Follow the standard procedure for installing plugins as described https://semanticgis.org/Tools/Desktop-GIS/QGIS/Tools/Managing-QGIS-plugins and search for the plugin named “Dataforsyningen”
Insert the token from dataforsyning
go to dataforsyning.dk and create and copy a token as described in Creating a token on dataforsyning.
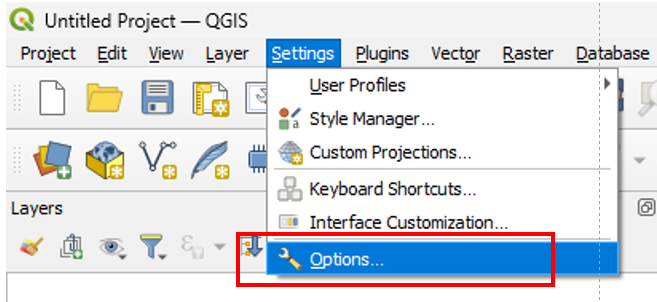
Go to Settings → Options
 Almost at the button of the list finde Dataforsuning
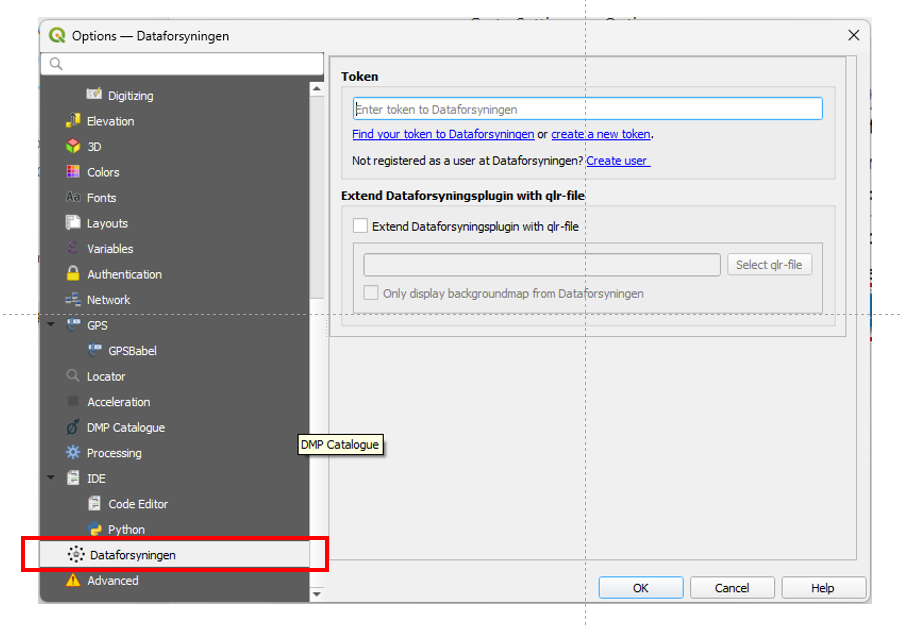 Paste the token you copied from dataforsyning into the field token and click ok.
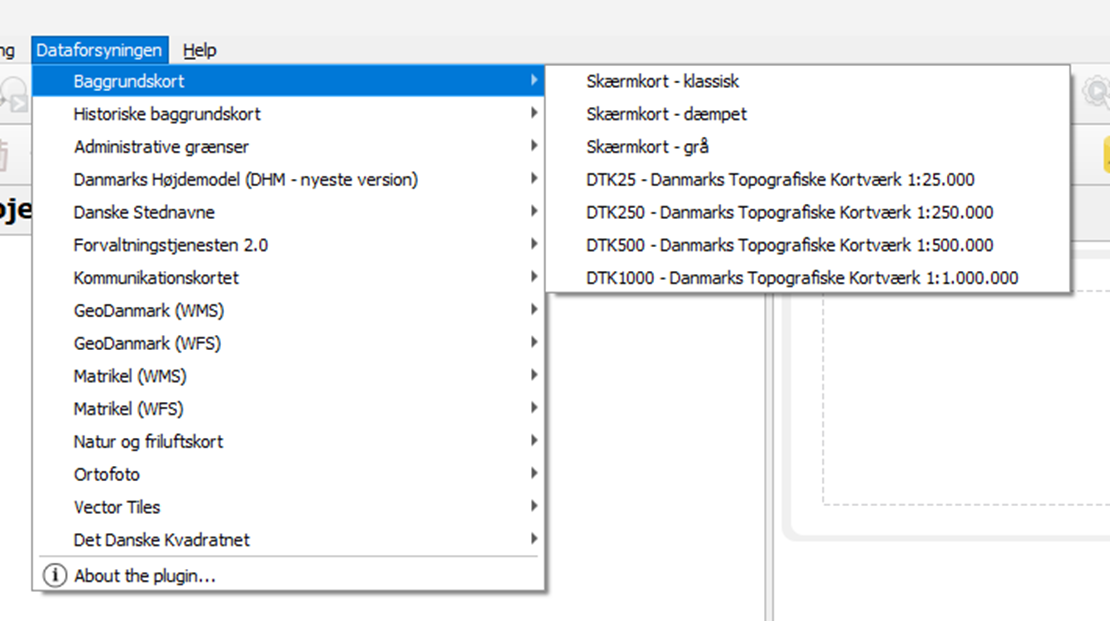
You should now have a new menu option in the top menu named Dataforsyning from which you can chose to load different data visualisations.
Paste the token you copied from dataforsyning into the field token and click ok.
You should now have a new menu option in the top menu named Dataforsyning from which you can chose to load different data visualisations.